Signals that lead to action
Customer operations components
Operations interfaces need more than attractive metrics. They must expose the comparison period, signal ownership, next action, and underlying records that explain a status. These components can form a customer success or revenue workspace while remaining useful in narrower application shells.
Why this set works
A stronger implementation baseline.
Metrics keep their unit, comparison period, and explanation together
Tables and boards provide keyboard-compatible actions
Operational ownership remains visible beside status and impact
Working source
Preview, customize, and download.
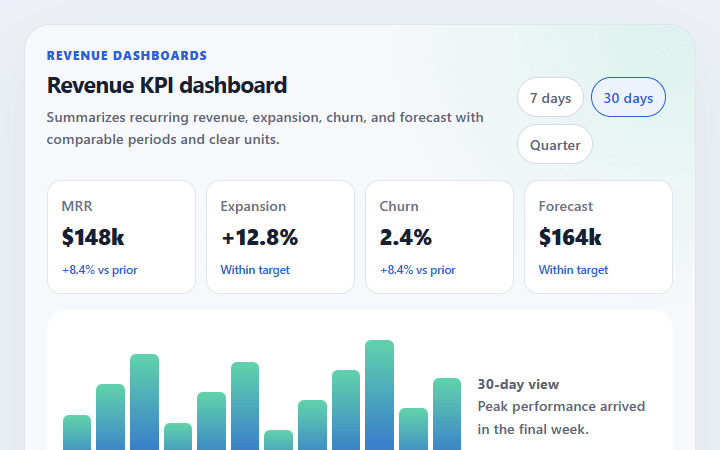
Revenue KPI dashboard
Summarizes recurring revenue, expansion, churn, and forecast with comparable periods and clear units.
Open component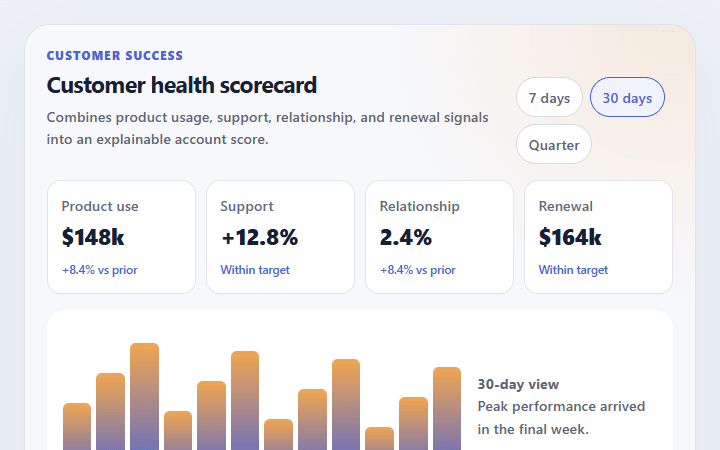
Customer health scorecard
Combines product usage, support, relationship, and renewal signals into an explainable account score.
Open component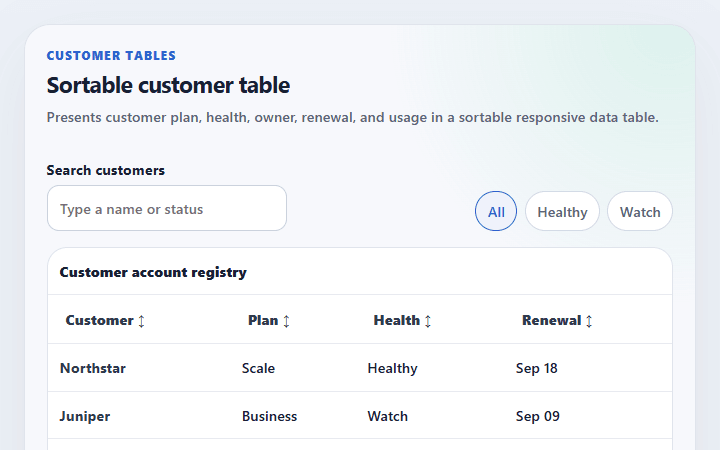
Sortable customer table
Presents customer plan, health, owner, renewal, and usage in a sortable responsive data table.
Open component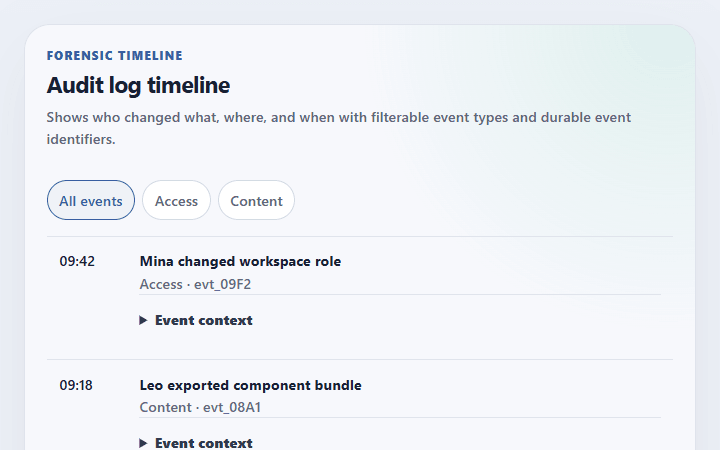
Audit log timeline
Shows who changed what, where, and when with filterable event types and durable event identifiers.
Open component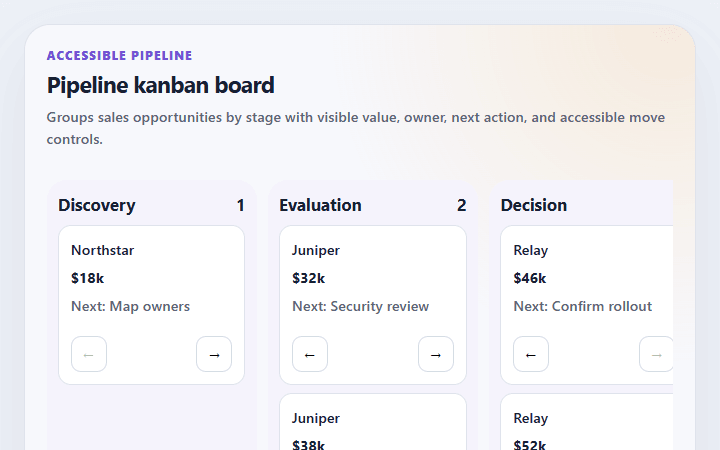
Pipeline kanban board
Groups sales opportunities by stage with visible value, owner, next action, and accessible move controls.
Open component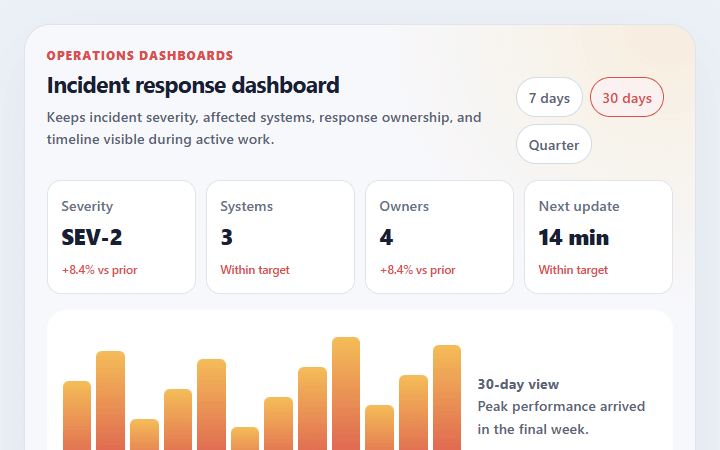
Incident response dashboard
Keeps incident severity, affected systems, response ownership, and timeline visible during active work.
Open componentBefore shipping
Implementation checklist.
Use these checks after adapting the components to your content and application state.
- 01
State the comparison period beside every changing metric.
- 02
Make account risk factors inspectable instead of publishing a black-box score.
- 03
Keep row actions available after the layout reflows for narrow screens.
- 04
Announce data movement and status changes without moving keyboard focus.
Implementation guidance